
Bring the meters you have
We'll tell you honestly what we can read.
Commercial and industrial
Half‑hourly data for every tenant, floor and circuit. Maximum demand and power factor against your notified maximum demand. And a balance between the incomer and the tenant meters that shows what isn't being billed.
A 30‑minute video call with the founder. Bring three months of bills for your largest supply.
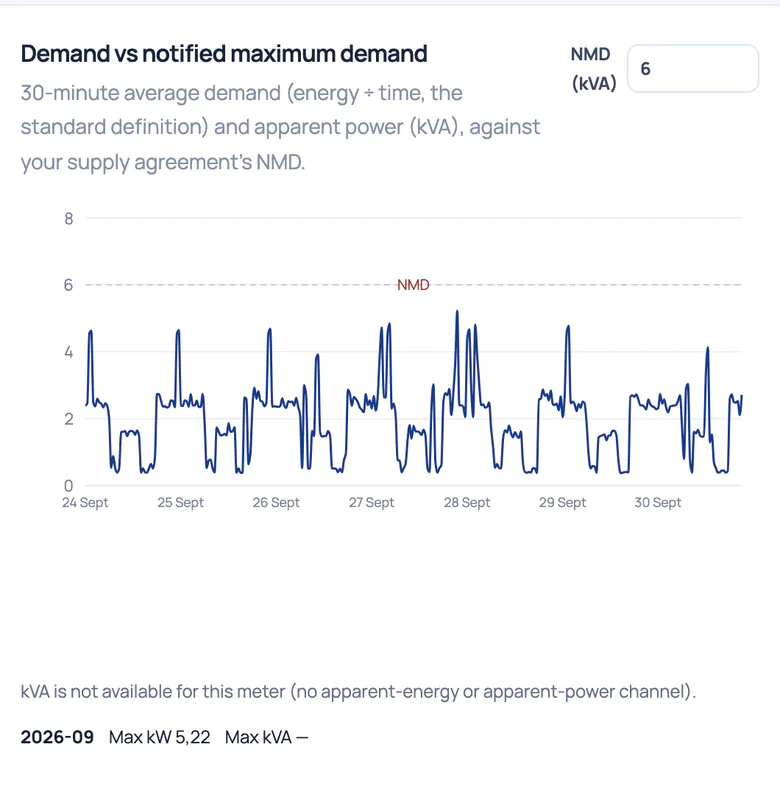
Needs meters that report kVA.
Every tenant, floor and circuit, every half‑hour.
The gap between the incomer and the tenants, and electrical warning signs.
A demand limiter you test on last month's data first.
Exports with cost for finance. Recovery billing is in preparation.
What the labels mean
Built and tested. We're choosing our first pilot sites.See what's built
See everything
The explorer shows every tenant meter, floor or circuit in half‑hours: a heatmap that can colour each half‑hour by tariff band and cost, spikes, baseload and events. Its C&I tab adds demand and power factor.
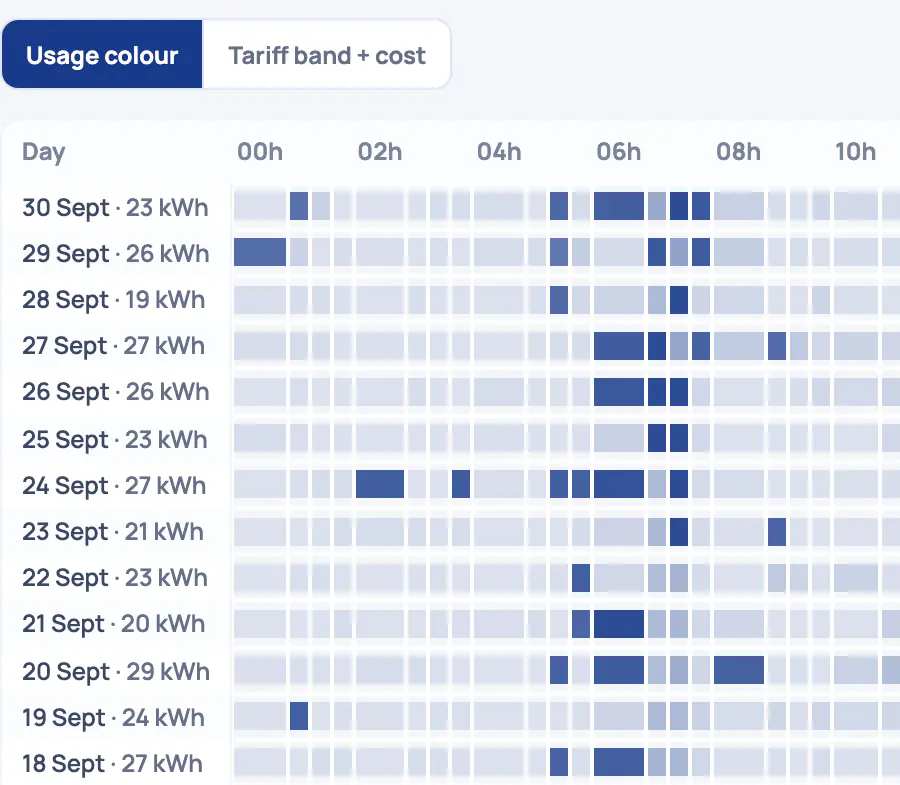
Group meters by tenant, floor or block. Gaps stay gaps; missing readings are never shown as zero.
30‑minute demand in kW and kVA, peaks against your notified maximum demand, exceedances and a load-duration curve.
Interval data to CSV and real Excel files with a cost column, plus statement CSVs.
See everything
Put smart meters on compressors, cold rooms, HVAC and production lines, and see each load's half‑hours, peaks and cost. We specify the meters and quote them after a survey.
Each load on its own meter, with its heatmap, spikes and always-on baseload, and its cost where a tariff applies.
Control what matters
The demand limiter watches demand against your notified maximum and sheds loads in the order you set, least important first: HVAC stages, water heaters or EV chargers. Test it on last month's data before you switch it on.
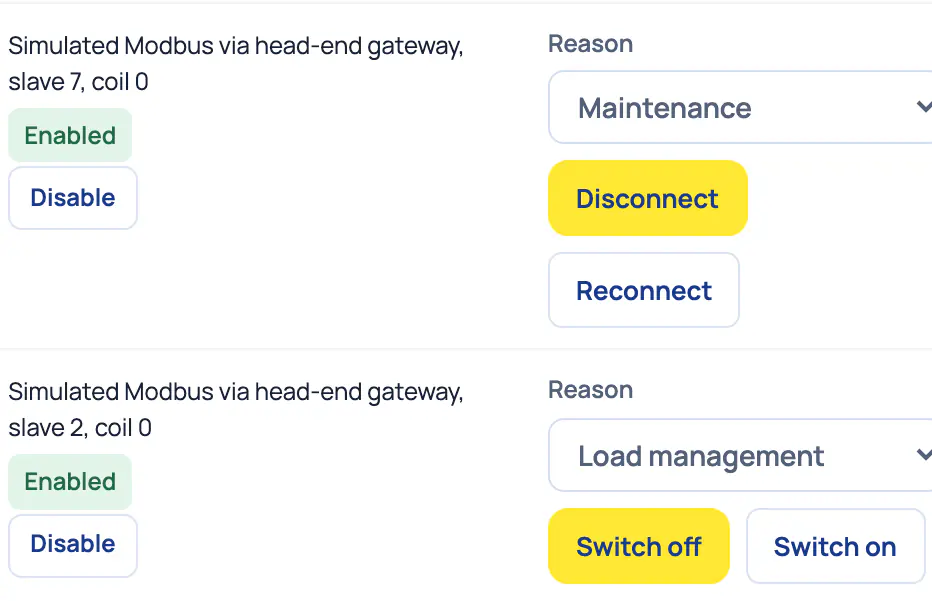
It restores loads in rotation as demand eases, so nothing stays off too long.
A manager enables each one, with a fresh confirmation. One switch stops every automation at once.
Each command is logged with who asked, why, and what the meter confirmed. Sent never counts as done.
Wi-Fi relays and smart plugs on the loads you choose, and an API for your data. Tell us what you'd connect.
Catch problems early
The incomer is compared with the tenant meters every half‑hour. When more goes missing than the site's own loss band allows, you see where, since when and how sure we are.
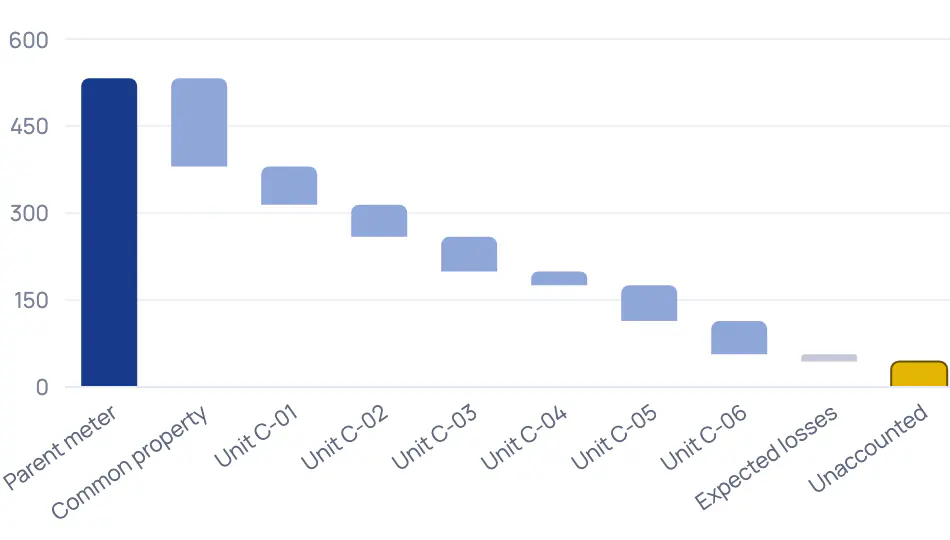
Compared only where every meter has complete data, with a waterfall of where the energy went.
Phase imbalance, a lost phase, a register that stops while current flows, and a reversed CT.
When meters go quiet, it says whether it's probably the supply or the communication, and how sure it is.
In preparation
Recovery billing with lease rules is designed, not built. Until it is, export the half‑hours and costs for your recoveries. Join the early-access list, and we'll send one message when it's ready.
Common-area pools by lettable area, caps and vacancies, with an export for your property accounting software.
Demand charges apportioned by which tenant caused the peak.
Generator and battery costs shared by metered use during verified outages.
Energy and carbon figures from your meters, ready for sustainability reports.
A day with Utilitize
What the platform does on its own, and where your team decides. Controls run on simulated devices until real relays are bench-tested.
Every half‑hour
Demand is worked out in kW and kVA, per meter, against the notified maximum demand you set. We never invent that figure.
A hot afternoon
Where relays are fitted, the demand limiter sheds the least important load first, then restores loads in rotation as demand eases.
Every step
Each command is logged with who or what asked, why, and what the meter confirmed.
When a phase drops
A lost phase or a reversed CT raises an alert, on meters that report every phase.
Month-end
Interval data and costs go to CSV and Excel for the property accountant. Recovery billing with lease rules is in preparation.
On site
What the features on this page need. We look at your incomer and tenant meters first.
Meters that report kVA
For demand and power factor. Many three-phase and DLMS meters do.
A check meter on the incomer
For the balance between the incomer and the tenants.
Meters that report every phase
For phase imbalance and lost-phase warnings.
Your notified maximum demand
We use the figure you give us, per supply.
Relays on loads you're willing to shedOptional
For the demand limiter: HVAC stages, water heaters or EV chargers.
We'll tell you honestly what we can read.
Questions
Not yet. Today the billing engine refuses to price a demand charge rather than guess. Demand split by cause is in preparation.
A specialist metering vendor fits better. Our explorer works in half‑hours, which is how demand is billed.
No. Real devices start switched off until a manager enables them, with a fresh confirmation. One switch stops every automation, and you can run monitoring only.
Not yet. Today you export interval data and costs to CSV and Excel. Recovery billing with lease rules, and an export for property software, is in preparation.
You'd see every load every half‑hour, demand against your notified maximum, the gap between your incomer and your tenants, and control the meter confirms. Run it side by side first: for pilots, we offer a shadow run on request, beside your current setup.
Bring the meters you have, and we'll tell you honestly what we can read. Our drivers cover Modbus (CHINT, Eastron), DLMS without encryption, IEC 62056‑21, wireless M‑Bus and LoRaWAN, so far tested on simulators. We confirm each model on your site first.
Bring three months of bills for your largest supply.